|
||
|
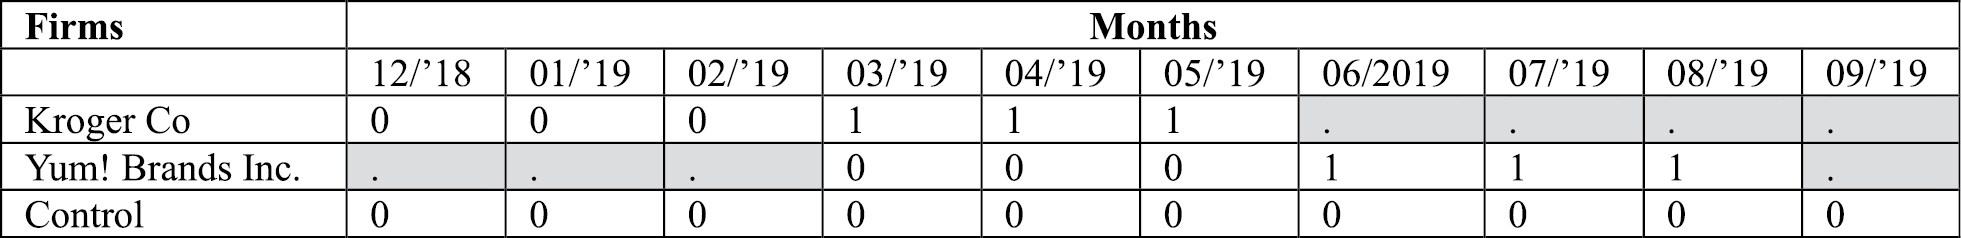
Research design. This figure illustrates our regression model using activism events from Kroger Co and Yum Brands! Inc. Our variable Treatment is equal to one at store locations in the three months following a firm’s LGBTQ+ activism event, zero in the three months before the event, and missing otherwise. Note that September 2019 has missing values on Treatment, which means it will be omitted from the regressions. Our model and this figure are based on Heese et al. (2022). |