|
Corresponding author: Tom Groot ( t.groot@vu.nl ) Academic editor: Tom Groot
© 2019 Yvonne Krabbe-Alkemade, Tom Groot, Jaap Boter.
This is an open access article distributed under the terms of the Creative Commons Attribution License (CC BY-NC-ND 4.0), which permits to copy and distribute the article for non-commercial purposes, provided that the article is not altered or modified and the original author and source are credited.
Citation:
Krabbe-Alkemade Y, Groot T, Boter J (2019) The impact of hospital competition and insurer concentration on health care volume and cost in Dutch hospitals. Maandblad Voor Accountancy en Bedrijfseconomie 93(7/8): 203-213. https://doi.org/10.5117/mab.93.34164
|
Abstract
This study analyses the effect of spatial concentration of general hospitals, the appearance of independent treatment centers (in Dutch: Zelfstandige Behandelcentra: ZBCs) and the concentration of health insurers on production volume and costs since the introduction of market-oriented health care reforms in the Netherlands. We use regression analyses of 1,345,144 patient-level hospital data for fifteen major diagnosis treatment combinations (in Dutch: Diagnose Behandeling Combinaties: DBCs), representing 70% of the managed competition segment (the so-called B-segment).
We find that spatial concentration of hospitals and concentration of insurers do not affect health care production volume. More competitive hospital markets are associated with higher cost of most DBCs studied. Surprisingly, hospitals operating under insurers with high monopsonic power incur higher average DBC-cost than hospitals operating under insurers with more dispersed power. The number of independent treatment centers in the hospital’s vicinity is positively related to health care volume and average cost.
Keywords
Health care, hospital, costing and pricing of health services, DBC, Independent Treatment Centers (ZBCs)
Practical relevance
This article provides insights into the workings of management care in the Dutch health care sector. It informs financial managers, supervisory bodies and politicians of the drivers of health care volume and health care costs. This information may enable policy makers and managers to more effectively control health care production and costs.
1. Introduction
In 2005, the Dutch government introduced managed health care competition with limiting conditions for liberalization and strong supervision (
Previous research on the case of the Netherlands has focused on the effect of managed competition on quality (
Standard microeconomic theory predicts that under perfect competition a larger supply of goods will in the short term lead to lower production costs and lower prices, or to higher quality offered for the same price. Empirical studies in health care markets, however, do not show a negative but rather a positive correlation between price levels and per capita supply of medical services (
2. Previous studies
Most of US studies examining hospital market power focus on the effect of hospital competition on prices and find a positive relation between hospital concentration and prices. This suggests that hospitals’ monopoly power leads to higher prices and that increasing price competition leads to lower prices (
The neighbourhood of Independent Treatment Centers appears to lead to the opposite effect. ITCs are single-specialty stand-alone centers for specialist care that provide elective surgery (for example hip replacements and cataracts) and diagnostic procedures (such as MRI scans). In the last years many such centers have entered hospital markets, such as the Ambulatory Surgery Centers (ASCs) in the US and the Independent Treatment Sector Centers in the UK. In the Netherlands, the government has allowed ITCs to facilitate efficient production, leaving the production of relatively higher cost specialties to hospitals. This means that hospital production will be lower and the average cost per patient will be higher (
The system of patient-driven competition, where purchasers operate under non-binding or soft budget constraints, has led to great inefficiencies and overconsumption of health care in the US (
In general, to date, most studies use hospital-level data and only few studies have used micro-costing data at the level of treatments, also referred to as episode level-data (
We more specifically expect that an increase in production and associated costs from managed competition will vary across hospitals and DBCs, depending on the local market structure. Increased competition between hospitals is expected to lead to higher DBC volume and average costs (the medical arms race argument), more ITCs in the proximity of hospitals will lower volume and increase average costs, and higher monopsony power of insurance companies will lead to lower volume and lower average costs.
We use a large dataset of 1,345,144 patient files for fifteen Diagnosis Treatment Combinations (DBCs), representing approximately 70% of the managed competition segment, generally referred to as the so-called B-segment. We also take the heretofore neglected entrance of ITCs into account as potential influencer of hospital production and cost. Thus, we aim to provide a much more detailed assessment of the effects of the reforms introduced in the Netherlands.
3. Research method
3.1 Data selection
The introduction of managed competition in 2005 coincided with a new registration system of DBC production, making it impossible to compare production and costs before and after market reform as a natural experiment. However, we expect market conditions not to have an immediate effect, but to take some time before affecting hospital performance. We therefore concentrate on the period shortly after introduction, covering the period 2005 to 2008. Our analysis is a multi-year analysis of the impact of differences in market conditions on hospital production volume and average costs. Price information is not publicly available, so we use an approximation of average cost instead.
From the segment of managed competition, we selected fifteen DBCs, jointly representing around 70% of the costs in the market-based payment system. Table
DBCs used in the sample, representing 70% of the health care costs in the B-segment.
| Diagnose | Name | DBC code |
|---|---|---|
| Cataract | Cataract (daycare) | 11 554 32 |
| Arthrosis | Arthrosis (total hip) | 11 1701 223 |
| Arthrosis (total knee) | 11 1801 223 | |
| Arthrosis knee (daycare) | 11 1801 212 | |
| Adenoid | Adenoid (daycare) | 11 52 212 |
| Adenoid (inpatient care) | 11 52 213 | |
| Inguinal hernia | Inguinal hernia (surgery and daycare) | 11 121 202 |
| Inguinal hernia (surgery and inpatient care) | 11 121 203 | |
| Varices | Varices dermatology | 11 24 41 |
| Varices surgery (daycare) | 11 423 202 | |
| Diabetes | Diabetes (first treatment, without complications) | 11 221 1101 |
| Diabetes (first treatment with complications) | 11 222 1101 | |
| Diabetes (following treatment without complications) | 21 221 1101 | |
| Diabetes (following treatment with complications) | 21 222 1101 | |
| Hernia | Hernia (low back pain) | 11 1203 111 |
Production of the fifteen DBCs over the period 2005 – 2008 comprises 1,559,351 patient files from 81 general hospitals, ranging from small regional hospitals to top-clinical large hospitals. The dataset does not include university and specialty hospitals. Registered hospital activity consists of outpatients’ visits, daycare, diagnostic activities (such as x-rays and lab activities) and nursing days. Additionally, information on patient and health insurer characteristics is available. We checked and validated the data on several aspects for completeness and correctness. We excluded extreme outliers from the database (
3.2. Model specification and variable measurement
To identify the impact of hospital and insurer competition on the volume and cost of hospital production in each of the fifteen sample DBCs, we estimate the following linear model:
djti = α + βMSjt + γOVjt + δQjt + ζPj + ηYt + εjti (1)
where djti is the dependent variable for hospital j at time t for each DBCi; MSjt is a vector of market structure variables for each hospital, which may vary over time; OVj is a vector of time dependent organizational characteristics; Qj contains quality measures; while the vectors Pj and Y are control variables, controlling for each hospital’s adherent population and three year dummies. The year dummies pick up common changes in the health care system.
For djt we use two dependent variables: production volume and average cost. The production volume of each DBCi is measured by the number of patient files registered, validated and reimbursed. The average cost of DBCi is calculated by valuing each activity in the patient file at national cost prices for 2005, and divide the total costs of all health care activities by the number of patient files to calculate a total average cost per DBC per hospital per year. The 2005 prices are also used for the valuation of DBCs in the remaining years, thus filtering out price fluctuations. We used the national price list of health care activities because real hospital cost prices are not available. We therefore are unable to detect cost price differences among hospitals. However, what our average cost price does detect is the intensity of care, based on volume and cost of health care activities performed for each DBC.
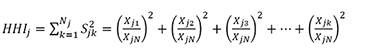
Hospital and insurer market structures are measured by the Herfindahl-Hirschman Index (HHI). The HHI is defined as the sum of squared market shares of all hospitals serving the same market (
 (2)
(2)
where Xjk is the production volume of hospital k of health service j, XjN is the total production of health service j by all hospitals in the relevant market, Sjk is the market share of hospital k in its relevant market j and Nj is the number of hospitals operating in that relevant market. To delineate the relevant market area we assume a desirable travel time of 15 minutes (
The concentration of the insurer market is determined in a similar way, using the HHI on the relative market shares of the insurance companies in financing a specific DBC to a specific hospital. Since the reform in 2005, some concentration on the health insurance market has taken place. Currently, five major health insurance holdings with each a number of insurance brands operate in the Netherlands. In case a health insurer does not belong to one of the five holdings, it is classified in the category “other”. We exclude hospitals if more than 10% of the DBCs cannot be identified to a health insurer.
The number of ITCs is taken from surveys from the Dutch Health Authority (NZa) of ITCs having invoiced DBCs to at least one health insurer. Websites and annual reports were reviewed to identify the treatments each ITC offers. For each DBC and each year the number of relevant ITCs is measured, taking into account the 15 minutes radius from each hospital, also including ITCs operating from within the hospital. For instance, when defining the relevant number of ITCs for the DBC ‘cataracts’, we take into account the number of ITCs providing ophthalmology treatments, while disregarding neighbouring ITCs that do not provide ophthalmology treatments.
We control for a number of organizational characteristics. First, larger hospitals should benefit from economies of scale effects, leading to lower costs; though empirical studies have shown mixed results. One early study found that larger hospitals have modest economics of scale benefits (
Second, we control for ‘the percentage of physicians with an employee status.’ Hospitals whose medical specialists have an employee status may be more successful in cost containment than hospitals with independent physicians (
Hospital quality is measured by two proxies: the percentage of cancelled surgeries and the AD quality score. The AD score is a proxy of overall hospital quality performance and is based on data of an annual survey (AD (Algemeen Dagblad) ranking top 100) between 2006 and 2008.
Socio-economic conditions of the adherent patients are captured by the percentage of immigrants and the percentage of population older than 65 in the market area, as supplied by the Statistics Netherlands office (CBS). A complete list of the variables used can be found in Table
Variable list.
| Variable | Definition | Source |
|---|---|---|
| Dependent variables | ||
| DBCvolumeij | Total number of DBCi in hospitalj | DIS *) |
| DBCcost ij | Average costs of DBC i in hospitalj | DIS |
| Independent variables | ||
| Market variables | ||
| Herfindahl index hospitals | Market concentration hospitals for hospitalj | DIS |
| Herfindahl index insurers | Market concentration insurers for hospital | DIS |
| Number of ITCs | Number of ITCs providing the same DBCi as hospitalj | NZA |
| Control variables | ||
| Organizational variables | ||
| Type of hospital | Dummy: 1=top clinical; 0=general hospital | Annual reports |
| DBC experiment | Dummy: 1=front runner; 0=no front runner | DBC Onderhoud |
| Budget hospital | Total revenues of hospitaln (in thousands €) | Annual reports |
| B-segment | Revenues B-segment / Total revenues | DIS |
| Physicians employed | Percentage of physicians with employee status in hospitalj | Annual reports |
| Quality | ||
| Cancelled surgeries | Percentage cancelled surgeries by hospitalj | Ziekenhuizen-transparant |
| Quality score hospital | AD score for hospitalj | Algemeen Dagblad |
| Population characteristics | ||
| Age > 65 in region | Percentage age > 65 of total population | CBS |
| Foreigners in region | Percentage foreigners of total population | CBS |
| Year | ||
| Year 2006 | Dummy: 1=2006; 0=other years | |
| Year 2007 | Dummy: 1=2007; 0=other years | |
| Year 2008 | Dummy: 1=2008; 0=other years | |
4. Results
As shown in Table
Descriptives.
| Variables | N | Minimum | Maximum | Mean | Std.Dev |
|---|---|---|---|---|---|
| Dummy type of hospital | 324 | 0 | 1.00 | 0.71 | 0.46 |
| Dummy DTC experiment | 324 | 0 | 1.00 | 0.37 | 0.48 |
| Budget hospital (*1000) | 324 | 23,343.00 | 274,197.00 | 101,685.00 | 59,158.00 |
| Revenues B-segment (*1000) | 321 | 1,421.00 | 52,000.00 | 12,903.00 | 9,806.00 |
| Total revenues hospital (*1000) | 324 | 26,903.00 | 357,623.00 | 124,000.00 | 71,460.00 |
| Percentage Segment B (%) | 321 | 2.45 | 40.37 | 13.91 | 8.99 |
| Number of patient files per DTCs | 294 | 336.00 | 10,395.00 | 4,336.00 | 2,071.00 |
| Herfindal index hospital (%) | 323 | 4.05 | 100.00 | 29.11 | 26.19 |
| Herfindal index health insurer (%) | 282 | 18.30 | 65.40 | 39.14 | 10.52 |
| Number of ITCs dermatology | 324 | 0 | 12.00 | 2.95 | 3.15 |
| Number of ITCs surgery | 324 | 0 | 7.00 | 2.19 | 2.02 |
| Number of ITCs otolary ncology | 324 | 0 | 3.00 | 0.35 | 0.73 |
| Number of ITCs internal medicine | 324 | 0 | 4.00 | 0.65 | 1.14 |
| Number of ITCs opthalmology | 324 | 0 | 9.00 | 2.11 | 2.30 |
| Number of ITCs orthopaedics | 324 | 0 | 40.00 | 10.97 | 10.16 |
| Total number of ITCs | 324 | 0 | 40.00 | 10.86 | 10.14 |
| Percentage physicians in service of hospital | 196 | 0 | 100.00 | 26.88 | 19.29 |
| Percentage of 65+ within region | 244 | 0.07 | 0.22 | 0.14 | 0.02 |
| Percentage of foreigners within region | 244 | 0.06 | 0.47 | 0.21 | 0.10 |
| Number of total surgeries in hospital | 297 | 688.00 | 57,348.00 | 12,203.00 | 7,293.00 |
| Percentage cancelled surgeries by hospital | 297 | 0 | 13.00 | 1.10 | 1.07 |
| Number of complaints submitted to Complaints Committee | 240 | 0 | 222.00 | 32.40 | 30.83 |
| Quality score hospitals AD | 242 | 37.97 | 82.28 | 63.09 | 8.42 |
| Number of DTCs Adenoid (daycare) | 323 | 1.00 | 1,285.00 | 413.31 | 253.28 |
| Number of DTCs Adenoid (inpatient care) | 323 | 1.00 | 493.00 | 137.67 | 102.49 |
| Number of DTCs Cataract (daycare) | 319 | 1.00 | 3,479.00 | 1,176.16 | 806.48 |
| Number of DTCs Diabetes first treatment without complications | 321 | 1.00 | 813.00 | 89.72 | 75.30 |
| Number of DTCs Diabetes first treatment with complications | 321 | 1.00 | 71.00 | 122.28 | 104.08 |
| Number of DTCs Diabetes following treatment without complications | 321 | 1.00 | 1,262.00 | 342.42 | 232.76 |
| Number of DTCs Diabetes following treatment with complications | 320 | 1.00 | 1,549.00 | 510.14 | 322.83 |
| Number of DTCs Hernia (low back pain) | 323 | 41.00 | 1,221.00 | 394.29 | 225.80 |
| Number of DTCs Inguinal hernia (daycare) | 321 | 2.00 | 445.00 | 147.47 | 91.71 |
| Number of DTCs Inguinal hernia (inpatient case) | 321 | 1.00 | 438.00 | 84.75 | 62.42 |
| Number of DTCs Total hip replacement | 322 | 1.00 | 537.00 | 201.46 | 114.06 |
| Number of DTCs Knee (daycare) | 321 | 1.00 | 541.00 | 85.88 | 98.45 |
| Number of DTCs Total knee replacement | 316 | 2.00 | 454.00 | 152.46 | 96.29 |
| Number of DTCs Varices dermatology (extended outpatient treatment) | 309 | 1.00 | 1,630.00 | 199.99 | 241.05 |
| Number of DTCs Varices surgery (surgery and daycare) | 321 | 3.00 | 569.00 | 144.74 | 97.86 |
There is an increase in the number of independent treatment centers from 37 in 2005 to 89 in 2008. In the period studied, the independent treatment centers had only a relatively small share of the managed competition segment (
Table
Selected DBCs change in volume and average cost 2005–2008.
| DBC name | Volume change 2005–2008 (%) | Cost change 2005–2008 (%) |
|---|---|---|
| Adenoid (daycare) – Otolaryngology | 11.73% | -1.53% |
| Adenoid (inpatient care) – Otolaryngology | 10.63% | -0.84% |
| Artrosis (knee daycare) – Orthopedics | 29.87% | -5.67% |
| Artrosis (total hip) – Orthopedics | 9.80% | -3.21% |
| Artrosis (total knee) – Orthopedics | 22.33% | -7.56% |
| Cataract (daycare) – Opthalmology | 11.24% | -12.23% |
| Diabetes (first treatment with complications) – Internal medicine | -11.20% | 13.37% |
| Diabetes (first treatment without complications) – Internal medicine | -46.29% | 19.31% |
| Diabetes (following treatment with complications) – Internal medicine | 16.22% | 9.15% |
| Diabetes (following treatment without complications) – Internal medicine | -28.68% | 13.57% |
| Hernia (low back pain) – Neurology | 0.35% | 11.09% |
| Inguinal hernia (surgery and daycare) – Surgery | 35.49% | 2.26% |
| Inguinal hernia (surgery and inpatient care) – Surgery | -35.76% | 4.47% |
| Varices (extended outpatient treatment) – Dermatology | 32.48% | 2.35% |
| Varices (surgery daycare) – Dermatology | 32.09% | -13.24% |
For seven out of the fifteen DBCs, average costs have decreased, while for eight of the fifteen DBCs average costs have increased. This result shows that the cost reduction objective was not fully met by the introduction of market competition for the sample care products. There is no obvious explanation for the average cost differences. We will try to explain the differences between DBCs in the remainder of the paper by using market structure and objective organizational characteristics as explanatory variables.
Our regression models in Table
Regression analysis of DBC volume as dependent variable.
| Adenoid -daycare | Adenoid -inpatient care | Cataract -daycare | Diabetes first treatment without complications | Diabetes first treatment with complications | Diabetes following treatment without complications | Diabetes following treatment with complications | Hernia Low back pain | Inguinal hernia -daycare | Inguinal hernia -inpatient care | Varices dermatology | Varices surgery -daycare | Artrosis total hip replacement | Artrosis total knee replacement | Knee -daycare | |
|---|---|---|---|---|---|---|---|---|---|---|---|---|---|---|---|
| Market variables | |||||||||||||||
| Herfindahl index hospitals -% | -0.047 | 0.063 | 0.096 | -0.057 | -0.045 | -0.090* | -0.066 | -0.163*** | -0.149** | 0.087 | -0.050 | 0.022 | -0.046 | 0.106* | 0.220*** |
| Herfindahl index health insurer -% | -0.090* | -0.086 | -0.004 | 0.084 | -0.052 | 0.251*** | 0.184*** | -0.007 | -0.110** | 0.066 | -0.070 | -0.074 | -0.144*** | -0.137** | 0.069 |
| Number of ICTs | 0.062 | 0.110** | 0.034 | 0.026 | 0.119** | 0.115** | 0.156*** | 0.083 | -0.139** | 0.069 | -0.043 | 0.157** | -0.010 | 0.140* | 0.429*** |
| Organizational variables | |||||||||||||||
| Type of hospital -dummy | 0.067 | 0.139** | 0.035 | -0.139* | -0.053 | -0.099 | -0.001 | -0.112* | -0.075 | -0.045 | -0.008 | -0.002 | 0.060 | 0.008 | 0.146** |
| DBC experiment -dummy | 0.025 | 0.099** | 0.059 | 0.010 | -0.015 | 0.012 | 0.001 | 0.131 | -0.033 | 0.028 | 0.002 | -0.002 | 0.058 | 0.026 | 0.087 |
| Budget hospital -*1000 | 0.666*** | 0.767*** | 0.727*** | 0.431*** | 0.455*** | 0.554*** | 0.670*** | 0.526*** | 0.700*** | 0.601*** | 0.596*** | 0.607*** | 0.837*** | 0.693*** | 0.632*** |
| B-segment -% | 0.274** | 0.548*** | 0.516*** | 0.169 | 0.227* | 0.375*** | 0.422*** | 0.176 | 0.320*** | 0.285** | 0.153 | 0.381*** | 0.526*** | 0.458*** | 0.634*** |
| Phycisians in service of hospital -% | -0.070 | -0.084* | -0.104** | -0.006 | 0.021 | -0.092* | -0.016 | -0.029 | 0.010 | -0.088** | -0.072 | -0.019 | -0.122*** | -0.050 | 0.074 |
| Quality | |||||||||||||||
| Cancelled surgeries | -0.010 | -0.020 | -0.091* | -0.022 | -0.042 | -0.068 | -0.093* | -0.057 | -0.102** | -0.089* | -0.090* | -0.129** | -0.170*** | -0.153*** | -0.053 |
| Quality score hospitals | -0.011 | -0.058 | 0.126*** | -0.126** | -0.119** | -0.068 | -0.008 | -0.009 | 0.011 | -0.137*** | -0.101** | 0.006 | 0.006 | -0.043 | -0.082 |
| Population | |||||||||||||||
| Age > 65 within region | -0.131** | 0.004 | -0.047 | 0.012 | 0.020 | -0.065 | 0.074 | 0.040 | -0.079 | 0.051 | 0.054 | -0.036 | 0.049 | 0.059 | -0.008 |
| Foreigners within region | -0.154*** | -0.094* | 0.106** | 0.005 | 0.040 | -0.110** | -0.053 | -0.010 | -0.120** | -0.096* | -0.058 | -0.099* | -0.137*** | -0.058 | -0.126** |
| Year 2006 | 0.039 | -0.024 | -0.032 | -0.269*** | -0.170*** | -0.081 | -.003 | -0.119** | 0.010 | -0.162*** | -0.019 | -0.072 | -0.082** | -0.005 | -0.110* |
| Year 2007 | 0.079 | -0.065 | 0.068 | -0.398*** | -0.234*** | 0.189*** | 0.013 | -0.078 | 0.132** | -0.297*** | -0.035 | 0.009 | -0.030 | 0.051 | -0.089 |
| Year 2008 | -0.178 | -0.472*** | -0.415*** | -0.492*** | -0.287** | -0.517*** | -0.272** | -0.160 | -0.091 | -0.528*** | -0.032 | -0.191 | -0.398*** | -0.287*** | -0.556*** |
| F-statistics | 13.170*** | 12.147*** | 14.919*** | 11.847*** | 7.441*** | 12.775*** | 12.893*** | 18.224*** | 14.348*** | 11.895*** | 9.681*** | 11.164*** | 24.812*** | 13.095*** | 7.281*** |
| Adj. R square | 0.361 | 0.341 | 0.393 | 0.335 | 0.230 | 0.354 | 0.356 | 0.444 | 0.383 | 0.336 | 0.287 | 0.321 | 0.525 | 0.360 | 0.226 |
As expected, more ITCs in the hospital’s proximity leads to significantly more production volume in predominantly more complicated care, like inpatient care and treatments with complications.
Table
Regression analysis of DBC average cost as dependent variable.
| Adenoid (daycare) | Adenoid (inpatient care) | Cataract (daycare) | Diabetes first treatment without complications | Diabetes first treatment with complications | Diabetes following treatment without complications | Diabetes following treatment with complications | Hernia Low back pain | Inguinal hernia (daycare) | Inguinal hernia (inpatient care) | Varices dermatology | Varices surgery (daycare) | Artrosis total hip replacement | Artrosis total knee replacement | Knee (daycare) | |
| Market variables | |||||||||||||||
| Herfindahl index hospitals (%) | -0.237*** | 0.009 | -0.278*** | 0.089 | 0.055 | 0.016 | 0.059 | -0.127* | -0.229*** | 0.049 | -0.179** | -0.251*** | 0.139** | 0.134* | -0.141* |
| Herfindahl index health insurer (%) | 0.016 | 0.109* | 0.075 | 0.153** | 0.125** | 0.128** | 0.110* | -0.027 | 0.148** | 0.193*** | 0.181*** | 0.137** | 0.153** | 0.205*** | 0.114* |
| Number of ICTs | -0.135** | 0.071 | -0.075 | 0.062 | 0.035 | 0.125** | 0.147** | 0.031 | 0.094 | 0.208*** | -0.130* | 0.092 | 0.275*** | 0.287*** | 0.164* |
| Organizational variables | |||||||||||||||
| Type of hospital (dummy) | 0.161** | -0.028 | 0.152* | -0.135* | -0.194*** | -0.186** | -0.140* | 0.051 | 0.041 | -0.098 | 0.096 | -0.026 | 0.057 | -0.038 | -0.060 |
| DBC experiment (dummy) | -0.037 | -0.106* | -0.009 | 0.024 | 0.010 | -0.040 | -0.037 | 0.082 | -0.073 | -0.094* | 0.130** | -0.046 | -0.130** | -0.124** | -0.023 |
| Budget hospital (*1000) | 0.324*** | 0.218** | 0.282*** | 0.036 | 0.007 | 0.003 | 0.199** | 0.125 | 0.171* | 0.163* | 0.192** | 0.057 | 0.444*** | 0.273*** | 0.072 |
| B-segment (%) | 0.128 | 0.231 | 0.183 | -0.087 | 0.047 | -0.005 | 0.125 | 0.113 | 0.195 | 0.204 | 0.150 | 0.211 | 0.321** | 0.312** | 0.177 |
| Phycisians in service of hospital (%) | -0.022 | -0.044 | -0.080 | -0.092* | -0.038 | 0.022 | 0.032 | 0.015 | 0.028 | 0.034 | -0.060 | 0.094* | -0.035 | -0.017 | 0.036 |
| Number of DBCs | -0.403*** | -0.121* | -0.168** | -0.259*** | -0.139** | -0.101 | -0.114* | -0.228*** | -0.135* | -0.250*** | -0.283*** | -0.113* | -0.467*** | -0.389*** | 0.022 |
| Quality | |||||||||||||||
| Cancelled surgeries | -0.024 | 0.014 | -0.026 | 0.061 | 0.091* | 0.024 | -0.018 | -0.028 | 0.007 | -0.007 | -0.050 | 0.058 | -0.035 | -0.046 | 0.099* |
| Quality score hospitals | 0.020 | 0.048 | -0.015 | -0.102* | -0.041 | -0.012 | -0.046 | 0.052 | -0.042 | -0.001 | 0.012 | -0.052 | -0.035 | -0.064 | -0.055 |
| Population | |||||||||||||||
| Age > 65 within region | 0.007 | 0.034 | 0.043 | 0.007 | 0.001 | 0.054 | 0.079 | -0.046 | 0.020 | 0.072 | 0.027 | -0.001 | 0.032 | 0.041 | 0.016 |
| Foreigners within region | 0.016 | 0.107 | -0.007 | 0.319*** | 0.244*** | 0.258*** | 0.281*** | -0.151** | -0.117* | 0.043 | -0.001 | -0.128* | 0.020 | 0.072 | -0.218*** |
| Year 2006 | -0.099 | -0.109 | 0.022 | 0.329*** | 0.562 | 0.227*** | 0.201*** | 0.201*** | -0.012 | -0.087 | -0.091 | -0.085 | -0.109* | -0.105 | 0.16 |
| Year 2007 | -0.150** | -0.166** | -0.049 | 0.317*** | 0.535 | 0.291*** | 0.259*** | 0.318*** | -0.049 | -0.184*** | 0.014 | -0.176** | -0.197*** | -0.197*** | -0.209*** |
| Year 2008 | -0.152 | -0.241 | -0.317* | 0.269* | 0.109 | 0.361** | 0.205 | 0.197 | -0.156 | -0.218 | -0.084 | -0.409** | -0.353** | -0.391** | -0.457*** |
| F-statistics | 4.152*** | 1.616 | 2.670*** | 7.805*** | 6.933*** | 5.479*** | 5.789*** | 3.666*** | 1.634* | 2.642*** | 2.968*** | 2.495*** | 5.130*** | 4.907*** | 4.013*** |
| Adj. R square | 0.135 | 0.030 | 0.076 | 0.252 | 0.227 | 0.182 | 0.192 | 0.117 | 0.030 | 0.075 | 0.089 | 0,069 | 0.170 | 0.162 | 0.130 |
This result lends some support to our expectation. Hospitals in highly competitive regions appear to incur higher average costs than hospitals in concentrated regions for most B-segment DBCs. This may indicate that hospitals in competitive markets provide more health care activities or spend more on amenities to attract patients. The average costs of virtually all DBCs are also negatively related to the number of patients treated (see variable “number of patient files per DBC”), indicating an economies of scale advantage for almost all sample DBCs.
The insurer market structure also does seem to have an impact on average cost, but this influence is opposite to what we expected. Hospitals operating under a concentrated insurer market are funded by a group of insurer companies dominated by one or only a few insurer companies which are able to exercise monopsony power. A more concentrated market is indicated by a higher value of the HH-index. We have measured insurer market concentration for each DBC separately. Table
Our finding coincides with the NZa general conclusion that Dutch insurance companies do not effectively use their monopsony power to control costs (
The number of ITCs in the vicinity of the focal hospital has a positive association with average costs for 6 out of the 15 sample DBCs. This result confirms our expectation for almost half of the sample DBCs. Most ITCs provide diagnostic services and basic care to patients with non-complex diseases. When ITCs take some of the less complex patients of the related hospital, this will increase the hospital’s average case mix complexity.
5. Conclusions
This study examined the impact of the market structure on hospital production and costs after the introduction of managed competition in the Netherlands in 2005. We investigated three parameters that potentially influence the hospital market: hospital concentration, insurer concentration and the proximity of new providers (ITCs). We investigated whether these market variables have an effect on volume and average costs of 15 DBCs, representing 70% of the management competition segment.
For all general hospitals combined, production has increased in the market competitive system after the introduction of health care reforms. This finding supports our expectation that the introduction of the Dutch managed competition system has led to an increase in hospital production. Regression analysis shows that neither spatial concentration of hospitals nor concentration of insurers is associated with volume of health care production. Hospitals are not increasing production more when the market is concentrated and dominant concentrations of health insurers have not been proven effective in controlling production volume. Apparently, under the new quasi-market system both hospitals and physicians are able to improve income by increasing health care production (
Although the average health care production appears to have increased, cost levels have changed differently for the health care products analyzed. Overall, the relationship between volume and costs seems to be negative, but explanations for this effect could be different per diagnosis or even per DBC. Hospital concentration has a significant impact on the reduction of average costs for most of the daycare products and leads to higher cost for hip and knee replacements. This is contrary to the expectation that low hospital concentration leads to lower average costs or hospital production. Our explanation is that competition between hospitals in competitive markets is more patient-driven so that hospitals in competitive markets provide extra services to attract patients.
A high concentration of insurers does not have a clear relationship with volume, but is associated with higher average costs for most of the health care products. This is contrary to our expectation that monopsony power leads to lower average costs. The effect of insurer concentration on costs is more significant than the effect of hospital concentration. It becomes clear that the practice of “selective contracting” is not taking place yet (
There are some limitations to our study; first of all, some limitations are related to the data. The DBC data and care activities, which have been delivered by the Dutch hospitals, constitute an important source of research material. However, the first years of registration of DBCs bear the risk that the production and the activity registration were not complete or not reliable. The dataset was analyzed on completeness, timeliness and correctness of the data. Based on this analysis we consider the data to be useful for further analysis. Also, no other study reported the use of a similar dataset to compare our results. The results can also be influenced by other incentives in the market. Until 2008 medical specialists, who are not in pay of a hospital, were reimbursed by a budget system (lump sum) and maximum hourly tariffs. In 2008, this compensation system was discharged and medical specialists are paid on the basis of the registered DBCs. This may have introduced volume induced incentives that could have influenced the 2008 volumes and cost.
This article is mainly concerned with the effects of market structure differences on health care production and costs. Further research could also focus on the effects on health care quality. The Dutch government has asked the Health Inspectorate to develop quality indicators. We need to wait for reliable quality indicators to see the impact of competition on health care quality (
List of abbreviations
ASC Ambulatory Surgery Center
CBS Statistic Netherlands Office
DBC Diagnosis Treatment Combinations
HHI Herfindahl-Hirschman Index
ITC Independent Treatment Center
Dr. Y.J.F.M. Krabbe-Akemade is researcher at Vrije Universiteit in Amsterdam.
Prof. dr. T.C.L.M. Groot is professor Management Accounting at Vrije Universiteit in Amsterdam.
Prof. dr. J. Boter is professor in Marketing at Vrije Universiteit and University of Amsterdam
Acknowledgments
The data were made available by the courtesy of the National Association of Hospitals (NVZ). We thank the NVZ for granting permission to use the Dutch hospital data.
References
- Barnett PG, Lin P, Wagner TH (2003) Estimating the costs of cardiac care provided by the hospitals of the US Department of Veterans Affairs. In: Weintraub WS (Ed.) Cardiovascular Health Care Economics. Springer (New York), 15–29. https://doi.org/10.1385/1-59259-398-4:15
- Bijlsma M, Koning P, Shestalova V, Aouragh A (2010) The effect of competition on process and outcome quality of hospital care. An empirical analysis for the Netherlands. CPB discussion paper no. 157. https://doi.org/10.2139/ssrn.1738924
- Botz CK, Sutherland J, Lawrenson J (2006) Cost weight compression: impact of cost data precision and completeness. Health Care Financial Review 27(3): 111–122. https://www.ncbi.nlm.nih.gov/pmc/articles/PMC4194951/
- Capps C, Dranove D, Satterthwaite M (2003) Competition and market power in option demand markets. Rand Journal of Economics 34(4): 737–763. https://doi.org/10.2307/1593786
- Carey K (2000) A multilevel modelling approach to analysis of patient costs under managed care. Health Economics 9(5): 435–446. https://doi.org/10.1002/1099-1050(200007)9:5<435::AID-HEC523>3.0.CO;2-Z
- Carey K, Burgess Jr JF, Young GJ (2011) Hospital competition and financial performance: the effects of ambulatory surgery centers. Health Economics 20(5): 571–581. https://doi.org/10.1002/hec.1617
- Carr JW, Feldstein P (1967) The relationship of cost to hospital size. Inquiry: a Journal of Health Care Organization Provision and Financing 4(2): 45–65. https://www.jstor.org/stable/41348572
- Courtemanche C, Plotzke M (2010) Does competition from ambulatory surgical centers affect hospital surgical output? Journal of Health Economics 29(5): 765–773. https://doi.org/10.1016/j.jhealeco.2010.07.003
- Enthoven AC (1978) Consumer-choice health plan (first of two parts). Inflation and inequity in health care today: alternatives for cost control and an analysis of proposals for national health insurance. The New England Journal of Medicine 298(12): 650–658. https://doi.org/10.1056/NEJM197803232981204
- Evans E, Imanaka Y, Sekimoto M, Ishizaki T, Hayashida K, Fukuda H, Oh EH (2007) Risk adjusted resource utilization for AMI patients treated in Japanese hospitals. Health Economics 16(4): 347–359. https://doi.org/10.1002/hec.1177
- Feldman R, Wholey D (2001) Do HMOs have monopsony power? International Journal of Health Care Finance and Economics 1(1): 7–22. https://doi.org/10.1023/A:1011595820483
- Frech III HE, Danger KL (1998) Exclusive contracts between hospitals and physicians: the antitrust issues. Health Economics 7(2): 175–178. https://doi.org/10.1002/(SICI)1099-1050(199803)7:2<175::AID-HEC338>3.0.CO;2-Z
- Grieve R, Nixon R, Thompson SG, Normand C (2005) Using multilevel models for assessing the variability of multinational resource use and cost data. Health Economics 14(2): 185–196. https://doi.org/10.1002/hec.916
- Grosskopf B, Gramsch A (2004) Leichenbrand – biologische quelle für Genderforschung [Cremation-biological source for gender research]. Anthropologische Anzeiger 62(3): 281–289. https://doi.org/10.1127/anthranz/62/2004/281
- Halbersma RS, Mikkers MC, Motchenkova E, Seinen I (2011) Market structure and hospital-insurer bargaining in the Netherlands. European Journal of Health Economics 12(6): 589–603. https://doi.org/10.1007/s10198-010-0273-z
- Heijink R, Mosca I, Westert G (2013) Effects of regulated competition on key outcomes of care: Cataract surgeries in the Netherlands. Health Policy. https://doi.org/10.1016/j.healthpol.2013.06.003
- Heinemann S, Leiber S, Gress S (2013) Managed competition in the Netherlands – A qualitative study. Health Policy 109(2): 113–121. https://doi.org/10.1016/j.healthpol.2012.08.025
- Liu X, Mills A (2007) Agency theory and its applications in health care. In: Preker AS, Liu X, Velenyi EV, Baris E (Eds) Public ends, private means. Strategic purchasing of health services. The World Bank, Washington, 151–178. http://documents.worldbank.org/curated/en/507851468158077332/Public-ends-private-means-strategic-purchasing-of-health-services
- Lynk WJ (1995) The creation of economic efficiencies in hospital mergers. Journal of Health Economics 14(5): 507–530. https://doi.org/10.1016/0167-6296(95)00019-4
- Lynk WJ, Neumann LR (1999) Price and profit. Journal of Health Economics 18(1): 99–116. https://doi.org/10.1016/S0167-6296(98)00040-X
- Martin S, Smith P (1996) Explaining variations in inpatient length of stay in the National Health Service. Journal of Health Economics 15(3): 279–304. https://doi.org/10.1016/0167-6296(96)00003-3
- Melnick G, Keeler E (2007) The effects of multi-hospital systems on hospital prices. Journal of Health Economics 26(2): 400–413. https://doi.org/10.1016/j.jhealeco.2006.10.002
- Melnick GA, Zwanziger J, Bamezai A, Pattison R (1992) The effects of market structure and bargaining position on hospital prices. Journal of Health Economics 11(3): 217–233. https://doi.org/10.1016/0167-6296(92)90001-H
- Ministry of Health (Ministerie van Volksgezondheid, Welzijn en Sport) (2001) Nota Vraag aan Bod: Hoofdlijnen van vernieuwing van het zorgstelsel. Den Haag: Tweede Kamer der Staten-Generaal. Kamerstukken 27855, no. 2 Vernieuwing van het zorgstelsel. https://zoek.officielebekendmakingen.nl/kst-27855-2.html
- Noether M (1988) Competition among hospitals. Journal of Health Economics 7(3): 259–284. https://doi.org/10.1016/0167-6296(88)90028-8
- NZa [Nederlandse Zorgautoriteit] (2008) Een analyse van de marktontwikkelingen in het B-segment. https://gupta-strategists.nl/studies/b-segment-onderzoek-naar-de-belangrijkste-ontwikkelingen
- NZa [Nederlandse Zorgautoriteit] (2011) Marktscan Medisch Specialistische Zorg: Weergave van de markt 2006–2010. https://www.nvog.nl/wp-content/uploads/2018/02/Marktscan_-Medisch-specialistische-zorg-1.0-28-01-2011.pdf
- NZa [Nederlandse Zorgautoriteit] (2012) Marktscan medisch specialistische zorg. Weergave van de markt 2008–2012. http://www.publicatiesarbeidsmarktzorgenwelzijn.nl/wp-content/uploads/2012/11/NZa-2012-Marktscan-medisch-specialistische-zorg-Weergave-van-de-markt-2008-2012.pdf
- Okma KG, Marmor TR, Oberlander J (2011) Managed competition for Medicare? Sobering lessons from The Netherlands. The New England Journal of Medicine 365(4): 287–289. https://doi.org/10.1056/NEJMp1106090
- Ozcan YA, Luke RD, Haksever C (1992) Ownership and organizational performance. A comparison of technical efficiency across hospital types. Medical Care 30(9): 781–794. https://doi.org/10.1097/00005650-199209000-00003
- Palmer G, Reid B (2001) Evaluation of the performance of diagnosis-related groups and similar casemix systems: methodological issues. Health Services Management Research 14(2): 71–81. https://doi.org/10.1258/0951484011912564
- Reuter J, Gaskin D (1997) Academic health centers in competitive markets. Health Affairs (Millwood) 16(4): 242–252. https://doi.org/10.1377/hlthaff.16.4.242
- Schreyögg J, Stargardt T, Tiemann O (2011) Costs and quality of hospitals in different health care systems: a multi-level approach with propensity score matching. Health Economics 20(1): 85–100. https://doi.org/10.1002/hec.1568
- Schut FT, Van de Ven WPMM (2005) Rationing and competition in the Dutch health-care system. Health Economics 14(Suppl 1): S59–74. https://doi.org/10.1002/hec.1036
- Schut FT, Van de Ven WPMM (2011) Managed competition in the Dutch health system: is there a realistic alternative? Health Economics, Policy and Law 6(1): 135–137. https://doi.org/10.1017/S1744133110000393
- Staten M, Umbeck J, Dunkelberg W (1988) Market share/market power revisited. A new test for an old theory. Journal of Health Economics 7(1): 73–87. https://doi.org/10.1016/0167-6296(88)90006-9
- Struijs JN, Van Til JT, Baan CA (2009) Experimenting with a bundled payment system for diabetes care in the Netherlands. The first tangible effects. https://www.rivm.nl/bibliotheek/rapporten/260224002.pdf
- Van de Ven WPMM, Schut FT (2009) Managed competition in the Netherlands: still work-in-progress. Health Economics 18(3), 253–255. https://doi.org/10.1002/hec.1446
- Van der Hijden E, Steenhuis S, Hofstra G, Van der Wolk J, Bijlsma W, Struijs J, Koolman X (2019) Ontwikkelingen in zorginkoop: van inkoop van verrichtingen naar inkoop van zorgbundels. Achtergrond, contractelementen en impact voor zorgaanbieders. Maandblad voor Accountancy en Bedrijfseconomie 93(5/6): xx-xx.
- Van der Schee E, Delnoij D, Kerssens J (2005) Keuze van ziekenhuizen: welke overwegingen zijn belangrijk voor consumenten? Tijdschrift voor Gezondheidswetenschappen 83(2): 113–115.
- Varkevisser M, Van der Geest SA (2007) Why do patients bypass the nearest hospital? An empirical analysis for orthopaedic care and neurosurgery in the Netherlands. European Journal of Health Economics 8(3): 287–295. https://doi.org/10.1007/s10198-006-0035-0
- Yafchak R (2000) A longitudinal study of economies of scale in the hospital industry. Journal of Health Care Finance 27(1): 67–89.
- Zwanziger J, Melnick GA (1988) The effects of hospital competition and the Medicare PPS program on hospital cost behavior in California. Journal of Health Economics 7(4): 301–320. https://doi.org/10.1016/0167-6296(88)90018-5