|
Corresponding author: Ralph ter Hoeven ( rterhoeven@deloitte.nl ) Academic editor: Chris D. Knoops
© 2021 Tristan Brouwer, Job Huttenhuis, Ralph ter Hoeven.
This is an open access article distributed under the terms of the Creative Commons Attribution License (CC BY-NC-ND 4.0), which permits to copy and distribute the article for non-commercial purposes, provided that the article is not altered or modified and the original author and source are credited.
Citation:
Brouwer T, Huttenhuis J, ter Hoeven R (2021) Empirical results for expected credit losses of G-SIBs during COVID-19. The proof of the pudding is in the eating. Maandblad voor Accountancy en Bedrijfseconomie 95(11/12): 381-396. https://doi.org/10.5117/mab.95.75980
|
Abstract
This study examines the provision for credit losses and its disclosures for Global Systemically Important Banks (G-SIBs) in connection to the COVID-19 crisis. We find a profound difference in the increase of the provision for credit losses between banks that report under IFRS and US GAAP. For banks that report under US GAAP, the provision for credit losses more than doubles, while it increases by only 32 percent for banks that report under IFRS. This difference becomes even more striking when considering that the increase for IFRS-reporting banks is partly attributable to increased lending activities. This study further finds that European auditors are more likely to issue a Key Audit Matter (KAM), than auditors of US banks, and that these KAMs specifically relate to COVID-19 in the financial year 2020. Furthermore, IFRS-reporting banks disclose more information on expected credit losses than banks that report under US GAAP. Moreover, we find that European banks disclose relatively more information regarding the impact of COVID-19 than banks reporting under US GAAP.
Keywords
ECL, Expected Credit Loss, Provision for Credit Losses, Loan Loss Provision, IFRS 9, IFRS 7, ASC 326, Financial Instruments, G-SIBs, Banks
Relevance to practice
This study provides a comprehensive analysis of the provision for credit losses of G-SIBs. The research provides insights on how the provision for credit losses has developed in times of a crisis. In addition, this study shows what the effect is of switching from an incurred loss model to an expected credit loss model. The study also offers best practices for the disclosures of the provision for credit losses.
1. Introduction
On 1 January 2018 the International Financial Reporting Standard (IFRS) 9 - Financial Instruments, published by the International Accounting Standards Board (IASB), became effective. The introduction of this new standard was a response to the global financial crisis of 2008. The main criticism of the old International Accounting Standard (IAS) 39 - Financial Instruments, was that the provision for credit losses was ‘too little, too late’ and increased procyclicality (
In late 2019 the COVID-19 virus emerged and quickly spread across the world. To prevent the virus from spreading, lockdowns were imposed together with other measures that were harmful for the economy
This study will add to the existing literature in several ways. To our knowledge we are the first to report on the impact of COVID-19 on the provision for credit losses. Although there is early research on the switch from an incurred loss model to an expected credit loss model (e.g.
The article is structured as follows; in Section 2 the credit loss provision stipulations under IFRS and US GAAP are summarized, along with the connection with academic research. In Section 3 the data and the sample of this study are described. The outcomes of our empirical analyses on expected credit losses are described and analysed in Section 4. Subsequently, Section 5 analyses the disclosures related to expected credit losses and offers best practices to the reader. This study is concluded by Section 6, in which we provide concluding remarks and give recommendations to further improve the quality of financial reporting.
2. Credit loss provision
The provision for credit losses is, for annual reports based on IFRS, determined by IFRS 9 (IASB 2020).
For banks, the ECL of IFRS 9 is mainly applicable to debt instruments that are financial assets measured at amortised cost, measured at fair value through other comprehensive income and loan commitments. The ECL is determined based on a three stages approach. In stage 1 the ECL is calculated for a twelve-month period. If a significant increase in credit risk (SICR) is observed or financial instruments are credit impaired, a lifetime ECL is required. These financial instruments are for determination of ECL referred to as stage 2 and 3, respectively. ASC 326 refers to determination of Current Expected Credit Losses (CECL). The main difference compared to IFRS 9, is that always a lifetime (C)ECL should be determined. As a result, US GAAP requirements do not include the determination of a significant increase in credit risk. Under both approaches, forward-looking information is considered for the calculation of the (C)ECL. Although the new ECL methodology will reduce procyclicality, research shows that the ECL approach in addressing procyclicality may also be less than hoped (
Both the IASB and FASB do not prescribe a certain methodology to determine (C)ECL and recognize the judgmental character of the estimate. As a result, the introduction of the (C)ECL models in IFRS and US GAAP was complemented by more extensive disclosure requirements, as outlined in IFRS 7 - Financial Instruments Disclosures and ASC 326 respectively.
For banks, considerations to include additional quality disclosure could highly relate to stakeholder and signalling theory (
3. Data
The sample of this study consists of the Global Systemically Important Banks (G-SIBs) as published by the Financial Stability Board as per November 2020.
Most of the banks have their year-end on 31 December. However, for Canadian banks the financial year ends on 31 October. The annual reports of these banks are counted towards the year closest to 31 December. Table
In Table
| Reporting standard | Count |
|---|---|
| IFRS | 18 |
| US GAAP | 9 |
| Total | 27 |
| Year | Amount of annual reports examined | Balance Sheet Total | Total Equity | Net Interest Income | Notional loans ECL portfolio | ECL provision | ECL as percentage of Total Equity | CET1 ratio | |
|---|---|---|---|---|---|---|---|---|---|
| 2018 | 27 | Average | 1,737,545 | 128,170 | 25,814 | 840,470 | 14,941 | 11.7% | 12.6% |
| Maximum | 4,023,912 | 338,479 | 83,170 | 2,072,640 | 71,271 | 16.9% | |||
| Minimum | 244,626 | 24,737 | 2,671 | 25,789 | 67 | 6.4% | |||
| 2019 | 27 | Average | 1,836,256 | 133,873 | 26,067 | 890,788 | 15,759 | 11.8% | 12.9% |
| Maximum | 4,311,972 | 383,257 | 86,918 | 2,345,011 | 79,212 | 16.4% | |||
| Minimum | 245,610 | 24,431 | 2,566 | 26,309 | 74 | 8.8% | |||
| 2020 | 27 | Average | 2,119,456 | 151,519 | 28,547 | 1,009,188 | 22,061 | 14.6% | 13.6% |
| Maximum | 5,122,468 | 446,960 | 99,356 | 2,861,062 | 96,966 | 17.4% | |||
| Minimum | 314,706 | 26,200 | 2,200 | 27,925 | 126 | 10.5% |
4. Quantitative analysis on expected credit losses
In this section we will provide a more detailed analysis of the increase of the provision for credit losses in our research period covering reporting years 2018, 2019 and 2020. The provision for credit losses is calculated over the gross carrying amount of the financial instruments, which is referred to as the notional amount of a financial instrument in this study. Table
| Year | N | Percentage ECL of notional Retail | Percentage ECL of notional Corporate | Percentage ECL of notional |
|---|---|---|---|---|
| 2018 | 27 | 1.39% | 1.38% | 1.39% |
| 2019 | 27 | 1.33% | 1.40% | 1.37% |
| 2020 | 27 | 1.90% | 1.77% | 1.80% |
There are large differences between the relative provision for credit losses between banks. Next to the difference in revenue sources, as explained in the previous section, differences in the application of the credit loss model between IFRS and US GAAP are also an important factor. In Section 2, it was mentioned that under IFRS there are three stages where only the lifetime expected credit loss is calculated for the instruments that belong to stage 2 or stage 3. However, large parts of the loan portfolios fall under stage 1, where only a twelve-month expected credit loss is calculated. Table
Provision for credit losses as a percentage of notional amount for banks that report under IFRS.
| Year | N | Percentage ECL of notional Retail | Percentage ECL of notional Corporate | Percentage ECL of notional |
|---|---|---|---|---|
| 2018 | 18 | 1.61% | 1.69% | 1.65% |
| 2019 | 18 | 1.53% | 1.68% | 1.61% |
| 2020 | 18 | 1.73% | 1.84% | 1.76% |
The increase in the relative provision for credit losses in 2020 is less profound for banks that report under IFRS. One reason for this might be that the IASB (
For banks that report under US GAAP, the lifetime expected credit loss (as per financial year 2020) is calculated for all financial instruments in scope. The provision for credit losses will therefore by definition be larger than under IFRS for a similar case. In table 5 the relative provision for credit losses is depicted for the subset of banks that report under US GAAP. The effect of the transition from an incurred loss methodology to an expected credit loss methodology in 2020 is clearly visible with the relative provision for credit losses increasing substantially. The table shows that the increase in the provision for the retail portfolio is larger than the increase in the provision for the corporate portfolio. This is also due to the characteristics of this portfolio. For the banks that report under US GAAP, the main part of the retail portfolio consists of credit card debts. For this debt category, there is no collateral, and this increases the expected credit loss.
Provision for credit losses as a percentage of notional amount for banks that report under US GAAP.
| Year | N | Percentage ECL of notional Retail | Percentage ECL of notional Corporate | Percentage ECL of notional |
|---|---|---|---|---|
| 2018 | 9 | 0.96% | 0.78% | 0.88% |
| 2019 | 9 | 0.94% | 0.83% | 0.89% |
| 2020 | 9 | 2.25% | 1.62% | 1.88% |
Table
| Year | N | ECL change compared with prior year | Change in notional compared with prior year | ECL change compared with prior year - US GAAP | Change in notional compared with prior year - US GAAP | ECL change compared with prior year - IFRS | Change in notional compared with prior year - IFRS |
|---|---|---|---|---|---|---|---|
| 2018/2019 | 27 | 4% | 6% | 8% | 2% | 2% | 7% |
| 2019/2020 | 27 | 56% | 13% | 105% | -1% | 32% | 16% |
The difference between the increase in the provision for credit losses is profound. For banks that report under IFRS the increase is not that substantial. Banks that report under US GAAP saw their provision for credit losses double on average. This observation is contradicting the results on procyclicality of
The European regulators urged European banks to carefully consider whether a significant increase in credit risk has occurred. European regulators requested a ‘holistic approach’ in the ECL staging assessment (
However, it should also be noted that the ECL model is tested in a period of large liquidity in the markets. Which is different compared to the situation of the global financial crises in 2008 which resulted in a critical evaluation of the incurred loss model. But it goes without saying that the COVID-19 crisis increases credit risks of bank’s loan portfolios in general. And as the proof of the pudding is in the eating, the application and outcome of the ECL-model is therefore assessed in times it was designed for.
For an outside stakeholder, it will be hard to judge whether all risks faced by the banks are reflected fairly in the credit loss provision. Banks can though provide detailed information, as explained by the stakeholder theory, in their disclosures that assist users in this judgement. These disclosures will be discussed in Section 5.
Another factor that influences the magnitude of the provision for credit losses, is the maturity of the loan portfolio. Table
Provision for credit losses as a percentage of notional amount based on the maturity of the loan portfolio.
| Year | N | Short maturity of loan portfolio (≤20%) | Medium maturity of loan portfolio (20<x<50%) | long maturity of loan portfolio (≥50%) |
|---|---|---|---|---|
| 2018 | 18 | 1.12% | 1.73% | 2.15% |
| 2019 | 18 | 1.14% | 1.50% | 2.26% |
| 2020 | 18 | 1.25% | 1.68% | 2.39% |
The auditor of the bank must concur with the expected credit loss model and the results which are recognized as provision for credit losses. The auditor can place additional emphasis on certain topics that were most important to the audit of the financial statements and can therefore inform stakeholders on the potential difficulties in understanding the provision for credit losses. For banks in the United States these topics are referred to as Critical Audit Matters (CAMs)13 and for the other banks in our sample these are Key Audit Matters (KAMs).14 The difference between the two audit matters is that the former is developed by the Public Company Accounting Oversight Board (PCAOB)15 and the latter is developed by the International Auditing and Assurance Standards Board (IAASB).16 The definition of CAMs and KAMs differ slightly, but can be roughly interpreted the same, as topics where an auditor places additional emphasis on during an audit. In the remainder of this study the two are set equally to each other and referred to as KAMs.
In 2020, the provision for credit losses was a topic that was under scrutiny. The increased uncertainty leads to more dispersed data that is fed into the ECL-models. Research has shown that there is no connection between the provision for credit losses and auditor-client economic bond (
| Reporting framework | N | KAM on ECL | Percentage of total | KAM on COVID-19 and ECL | Percentage of total |
|---|---|---|---|---|---|
| IFRS | 18 | 18 | 100% | 16 | 89% |
| US GAAP | 9 | 7 | 78% | 2 | 22% |
In prior research it was found that for European banks only 73 percent of the auditors raised a KAM at the implementation of IFRS 9 (
5. Analysis of expected credit loss disclosures
To assess the quality of the portfolio and ECL coverage, the disclosures on the provision for credit losses are of utmost importance to stakeholders (
The first notable finding is criterion number 7: “Disclosure regarding what is defined as a significant increase of credit risk”. All banks that report under IFRS disclose what they define as a SICR. Contrarily, the banks reporting under US GAAP do not disclose this element. As mentioned earlier, this is due to the different methodologies used under both reporting frameworks. Under IFRS the SICR definition is needed to decide when an instrument is moved from stage 1 to stage 2. Under US GAAP there is however no staging and therefore no SICR definition is needed.
The provision for credit losses under IFRS needs to be determined as “an unbiased and probability-weighted amount that is determined by evaluating a range of possible outcomes”.17,18 The calculation of expected credit losses therefore needs to incorporate multiple scenarios and these scenarios should be probability weighted. The disclosure of the weights will reflect the assumptions used by management in the calculation of the expected credit loss. The results of criterion number 13: “Disclosure of weight of each scenario” show that only half of the banks explicitly state the probabilities that are used in the calculation. Banks that report under IFRS do mention the weights more often (61%) than banks that report under US GAAP (22%). The weights that are used in the calculation are not stationary throughout time and therefore the disclosure provides valuable information. The disclosure of HSBC, as shown in Figure
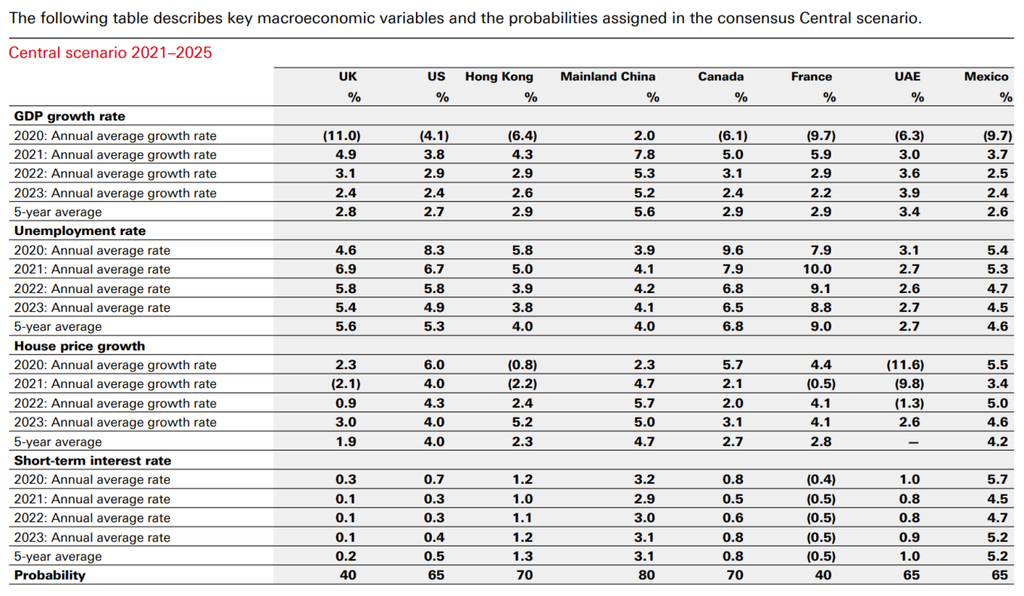
Best practice of disclosure of scenario weights: HSBC Holdings plc Annual Report and Accounts 2020, p. 128. https://www.hsbc.com/-/files/hsbc/investors/hsbc-results/2020/annual/pdfs/hsbc-holdings-plc/210223-annual-report-and-accounts-2020.pdf
It is important for stakeholders to be able to assess the assumptions used in the calculation of expected credit losses and to analyse the sensitivity of the provision for credit losses when assumptions change. Disclosures that include sensitivity analyses are therefore important and this is also accentuated by regulatory bodies (

Best practice of sensitivity analysis: ING Groep N.V. Annual Report 2020, p. 140. https://www.ing.com/Investor-relations/Financial-performance/Annual-reports.htm
Economic cycles impact the instruments that banks hold in their portfolios. Loans originated during booming economic times could be at risk during downturn times when residential and corporate borrowers could suffer from the worsened conditions. It can therefore be insightful to disclose the origin of the instruments in the portfolio to judge the credit quality of the instruments. One way to disclose this is to provide loan origination tables. Criterion number 19: “Quantitative disclosures on loan origination” measures these disclosures. For banks that report under US GAAP such disclosures are required for certain instruments according to ASC 326-20-50-6. In our sample only one bank disclosed these ‘vintage’ tables in an unambiguous way. Figure

Best practice of loan origination disclosure: Wells Fargo & Company Annual Report 2020, p. 155. https://www08.wellsfargomedia.com/assets/pdf/about/investor-relations/annual-reports/2020-annual-report.pdf
The provision for credit losses increased substantially during the pandemic, as was discussed in Section 4. For stakeholders it is important to gain insight into where this increase is stemming from. In the assessed criteria, criterion number 25: “Disclosure on development of ECL” assesses the disclosure on the changes of the provision for credit losses compared to prior year. Most of the banks that report under IFRS disclose this information (83%), but only two banks (22%) that report under US GAAP disclose this. Figure

Best practice of ECL movement disclosure: Deutsche Bank Annual Report 2020, p. 80. https://investor-relations.db.com/files/documents/annual-reports/Annual_Report_2020.pdf
The last items of the assessed criteria are specifically focused on disclosures regarding the impact of COVID-19. Table
Best practice of management overlay disclosure: Standard Chartered Annual Report 2020, p. 228. https://av.sc.com/corp-en/content/docs/standard-chartered-plc-full-year-2020-report.pdf
|
Management overlay - COVID-19
As at 31 December 2020, the Group held a $359 million management overlay relating to uncertainties as a result of the COVID-19 pandemic that are not captured by the models, $197 million of which relates to Corporate & Institutional Banking and Commercial Banking and $162 million to Retail Banking. The overlay has been determined after taking account of the PMAs reported on page 225 and is re-assessed quarterly. It is reviewed and approved by the IFRS9 Impairment Committee. |
| Disclosure elements | Total Count | Percentage | Count IFRS | Percentage | Count US GAAP | Percentage |
|---|---|---|---|---|---|---|
| ECL post model adjustment (Management Overlay) is explained | 15 | 56% | 10 | 56% | 5 | 56% |
| Debt moratoria (payment holidays) granted and effect on Financial statement is explained | 24 | 89% | 15 | 83% | 9 | 100% |
| Impact of debt moratoria on SICR definition is disclosed | 13 | 48% | 13 | 72% | 0 | 0% |
| Disclosure regarding the exposures subject to the payment moratoria | 15 | 56% | 12 | 67% | 3 | 33% |
| Change of inputs (and forecasting) in ECL models compared with prior years | 18 | 67% | 13 | 72% | 5 | 56% |
| Have the different scenarios (and their weights) used in the ECL calculation changed, compared to prior year | 16 | 59% | 12 | 67% | 4 | 44% |
| Dislcosure regarding movements from Stage 1 to Stage 3 | 15 | 56% | 15 | 83% | 0 | 0% |
Almost all banks disclose the debt moratoria granted to certain portfolios and the exposure to these portfolios. The impact of the debt moratoria on the definition of SICR is also disclosed by most of the banks and some banks refer to the guidance that has been issued by the IASB (
Finally, this study has investigated the attention for COVID-19 in the financial statements. Following
Number of COVID-19 or corona occurrences in the 2020 financial statements.
| Region | N | Statistic | Total | IFRS | US GAAP |
|---|---|---|---|---|---|
| Europe | 13 | Average | 243 | 245 | 220 |
| Maximum | 410 | 410 | 220 | ||
| Minimum | 80 | 80 | 220 | ||
| Asia | 4 | Average | 55 | 55 | N/A |
| Maximum | 101 | 101 | N/A | ||
| Minimum | 21 | 21 | N/A | ||
| North America | 10 | Average | 102 | 168 | 85 |
| Maximum | 208 | 208 | 205 | ||
| Minimum | 2 | 128 | 2 |
6. Conclusion
In this study the provision for credit losses and its accompanying disclosures were investigated. The difference in the increase of the provision for credit losses between the reporting frameworks is profound. For banks that report under IFRS the increase is not that substantial. Banks that report under US GAAP determined a provision for credit losses which doubled on average. This difference can in part be attributed to the switch from an incurred loss model to an expected credit loss model under US GAAP as per financial year 2020 and partly to the difference in calculating expected credit losses. The increase for banks that report under US GAAP can be interpreted as a signal about the robustness of the bank. The results also indicate that the longer the maturity of the loan portfolio, the higher the relative provision for credit losses is. Furthermore, the increase in the provision for credit losses due to the pandemic is consistent across all maturity buckets.
The auditors of banks that report under IFRS have all raised a KAM related to the provision for credit losses. The auditors of banks that report under US GAAP have raised a KAM for most of the banks. For banks that report under IFRS almost all auditors discuss the impact of the pandemic in the respective KAM on the provision for credit losses, except for the auditors of two Chinese banks. The auditors of the banks that report under US GAAP do not assess the pandemic as an important influence on the provision of credit losses, reflected by the low percentage of KAMs related to the pandemic. The KAMs issued by the auditors of banks that report under US GAAP mostly relate to the transfer from an incurred loss model to an expected credit loss model.
For the calculation of expected credit losses only half of the banks explicitly state the probabilities that are used in the calculation. Banks that report under IFRS do mention the weights more often (61%) than banks that report under US GAAP (22%). The disclosures regarding sensitivity analysis show that only a slight majority of the banks includes a sensitivity analysis in the financial statements. The reasons for the key assumptions used and the methodology applied are less often disclosed. In our sample there was only one bank that reported vintage tables, although this is a requirement under US GAAP. These tables can provide valuable information on the credit quality of the loan portfolio and can increase the information usefulness of the financial statements. One recommendation is therefore to incorporate these tables in the disclosures on financial instruments. The disclosure regarding the movements of ECL will also add value to the financial statements. For banks that report under IFRS the majority (83%) disclose this information but only two banks (22%) from our sample that report under US GAAP disclose this information.
The results show that most banks report that a management overlay is used in the calculation. This management overlay is however seldomly quantified. It is therefore difficult to assess what the impact of the management overlay is on the provision for credit losses. The debt moratoria granted (89%) and the exposure to these portfolios (56%) are disclosed by most of the banks. The impact of the debt moratoria on the definition of SICR and the impact of the pandemic on the inputs is also disclosed by most of the banks (72% and 67%, respectively). For the calculation of the provision of credit losses banks use different scenarios and assign different weights to these scenarios. There are however banks that only update the scenarios but do not update the weights that they assign to the scenarios. Finally, the transfer from stage 1 to stage 3 has been disclosed by most banks (83%). Given that this disclosure is not a requirement, this highlights pro-activity from banks.
This study has investigated multiple aspects of the (disclosure for the) provision for credit losses. It was shown that the difference between the provision for credit losses has increased between European banks and their counterparts from the United States. This is partly caused by the European regulators’ ‘call for care’ in assessing significant increases in credit, hence, to not transfer loans too swiftly from stage 1 to stage 2. Such a message was not given by the regulators in the United States. The question can also be asked to what extent the actual risks that the European banks faced are expressed in the provision for the credit losses, because the European regulators were promoting a holistic approach and not really stressing the importance of early recognition of losses as a pivotal feature of the expected credit loss model. If the proof of the pudding is in the eating, then for European banks it appears that due to diet impulses the pudding appears to be mainly untouched. Where it should also be noted that the ECL model is tested in times of large liquidity in the markets. Which is different compared to the situation of the global financial crises in 2008 that caused the IASB to reconsider the incurred credit loss model and introduce an expected credit loss model.
The conclusion of this study is that banks that report under IFRS have more insightful disclosures related to their counterparts that report under US GAAP. European banks place most emphasis on disclosures regarding COVID-19 and the Chinese banks disclose the least amount of information regarding the COVID-19 impact. We do believe that the continuing message that the ESMA provides to the market in its yearly European Common Enforcement Priorities statements, contributes favourably to this outcome. In these statements ESMA encourages listed companies to provide entity-specific disclosures in different areas. Finally, we also hope that this article will encourage efforts in this direction of making company-specific and tailored disclosures which are of key importance in meeting the objective of general-purpose financial reporting: providing useful information to existing and potential investors, lenders and other creditors.
This study has added to the existing literature in several ways. To our knowledge this was the first study to report on the impact of COVID-19 on the provision for credit losses. In addition, this study has added to the existing literature by describing the impact of the switch from ASC 310 to ASC 326. Lastly, this article has contributed to research related to provisions for credit losses by describing the impact of COVID-19 on expected credit losses and incorporating the quality of the disclosures regarding expected credit losses.
We encourage other researchers to perform further research on the impact of COVID-19 on the provision for credit losses. Future research can use different research methodologies (e.g. statistical analyses) to determine the significance of the observed increase in the provision for credit losses. In addition, future research can increase the sample size that has been used in this study, to find consistent results for the industry instead of only the G-SIBs. Finally, future research can investigate the quality of the disclosures and relate this the increase in the provision for credit losses.
T.L. (Tristan) Brouwer MSc is Senior Associate at PwC and (part-time) assistant professor Financial Reporting at the University of Groningen.
J.G. (Job) Huttenhuis MSc EMA RA is Head of Finance at MUFG Bank (Europe) N.V. and (part-time) assistant professor Financial Reporting at the University of Groningen.
Prof. dr. R.L. (Ralph) ter Hoeven RA is partner in the Technical Office of Deloitte Accountants Netherlands and professor Financial Reporting at the University of Groningen.
The authors wrote this article in a personal capacity.
Notes
As evidenced by a reduction of the gross domestic product (GDP) of the global economy of 3.2% in 2020 compared to 2019. Refer to: https://www.statista.com/statistics/268750/global-gross-domestic-product-gdp/. Further reference is made to the data of the Organisation for Economic Cooperation and Development (OECD) for information on GDP developments per country. Refer to https://www.oecd.org/economy/weekly-tracker-of-gdp-growth/
“an unbiased and probability-weighted amount that is determined by evaluating a range of possible outcomes” and taking into account “reasonable and supportable information that is available without undue cost or effort at that date about past events, current conditions and forecasts of future economic conditions” [IFRS 9, paragraph 5.5.17]. ASC 326 does not prescribe the ECL methodology as explicitly as IFRS 9, however in practice similar assessments are made which are (also) in line with the requirements of US GAAP.
Canada 1 November 2017, Europe 1 January 2018, China 1 January 2018.
Applicable to SEC filers for fiscal years beginning after 15 December 2019. For non-SEC public companies applicable for fiscal years beginning after 15 December 2020. For other companies applicable for fiscal years beginning after 15 December 2022.
The cliff effect arises because of the staging that is present under IFRS 9. Once a loan has a SICR, and therefore moves to stage 2, the provision for credit losses will not be calculated with a 12 month ECL, but with a lifetime ECL. This results in a large increase in the provision for credit losses once a SICR has taken place. For a detailed explanation, please refer to
Reference made to IFRS 7.35 and ASC 326-20-50.
For the complete list of G-SIBs that is published by the Financial Stability Board, please refer to: https://www.fsb.org/2020/11/2020-list-of-global-systemically-important-banks-g-sibs/
For the calculation methodology, please refer to: https://www.bis.org/bcbs/publ/d296.pdf
The CET 1 ratio is defined as the Common Equity Tier 1 (CET 1) capital divided by the risk weighted assets and measures the ability to withstand financial distress.
Examples of support measures are the CARES act in the United States. EU countries all set-up their own programmes, were the Dutch Government provided an overview of the multiple measures https://www.rijksoverheid.nl/onderwerpen/coronavirus-financiele-regelingen/overzicht-financiele-regelingen.
For the announcement from the ECB, please refer to https://www.ecb.europa.eu/press/pr/date/2020/html/ecb.pr200312_1~39db50b717.nl.html
The robustness of the results have been tested by applying different percentages, such as 40% for the long maturity bucket. The results remained robust after changing these percentages. The choice for these specific percentages is motivated by the bell-shaped distribution. Hence 5 banks in the low maturity bucket, 8 banks in the medium maturity bucket and the final 5 banks in the long maturity bucket.
AS 3101.11 describes CAMs as: “A critical audit matter is any matter arising from the audit of the financial statements that was communicated or required to be communicated to the audit committee and that: (1) relates to accounts or disclosures that are material to the financial statements and (2) involved especially challenging, subjective, or complex auditor judgment.”
ISA 701.8 describes KAMs as: “Those matters that, in the auditor’s professional judgment, were of most significance in the audit of the financial statements of the current period.”
The PCAOB is the regulatory body in the United States which oversees the audits of public companies.
The IAASB publishes professional standards for the auditing of financial information, which are adopted to local standards in a substantial number of countries.
This is set out in IFRS 9.5.5.17 (a).
Under US GAAP no method for determining expected credit losses is prescribed. However, the majority of the banks that report under US GAAP follow a similar approach as is prescribed under IFRS.
Purchased or originated credit-impaired (POCI) financial assets are already credit impaired at initial recognition. That means that their staging does not start from stage 1 but the originated or purchased assets are immediately categorised as stage 3. These assets have to be distinguished from stage 3 assets that started in stage 1 at the moment of initial recognition. These assets suffer from a credit loss event after initial recognition.
Please note that only the first part of the disclosure has been included. The detailed information in the remainder of the disclosure has not been included for the sake of brevity.
Refer to IFRS 7.35H.
References
- Abad J, Suarez J (2018) The procyclicality of expected credit loss provisions, CEPR Discussion Paper No DP13135. https://papers.ssrn.com/sol3/papers.cfm?abstract_id=3244507
- AFM (Autoriteit Financiële Markten) (2020) In Balans 2020 - De effecten van Covid-19:
- Themaonderzoek naar de toelichting van de effecten van Covid-19 in de halfjaarlijkse financiële verslaggeving 2020.
- Agénor PR, Zilberman R (2015) Loan loss provisioning rules, procyclicality, and financial volatility. Journal of Banking & Finance 61: 301–315. https://doi.org/10.1016/j.jbankfin.2015.08.035
- Barnoussi AE, Howieson B, Van Beest F (2020) Prudential application of IFRS 9: (Un) Fair Reporting in COVID‐19 crisis for banks worldwide?! Australian Accounting Review 30(3): 178-192. https://doi.org/10.1111/auar.12316
- BCBS (Basel Committee on Banking Supervision) (2021) Working Paper 39 The procyclicality of loan loss provisions: a literature review. https://www.bis.org/bcbs/publ/wp39.pdf
- Beaver W, Eger C, Ryan S, Wolfson M (1989) Financial reporting, supplemental disclosures, and bank share prices. Journal of Accounting Research 27(2): 157–178. https://doi.org/10.2307/2491230
- Bischof J, Laux C, Leuz C (2021) Accounting for financial stability: Bank disclosure and loss recognition in the financial crisis. Journal of Financial Economics 141(3): 1188–1217. https://doi.org/10.1016/j.jfineco.2021.05.016
- Breeden JL (2018) CECL procyclicality: It depends on the model. Prescient Models LLC. https://www.prescientmodels.com/articles/CECL-Procyclicality.pdf
- Buesa A, Población FJ, Tarancón J (2019) Measuring the procyclicality of impairment accounting regimes: A comparison between IFRS 9 and US GAAP. ECB Working Paper Series No. 2347. https://www.ecb.europa.eu/pub/pdf/scpwps/ecb.wp2347~35d0728499.en.pdf
- Campa D, Donnelly R (2019) Loan loss provisions in large publicly quoted European banks and auditor independence. International Journal of Auditing 23(2): 245–262. https://doi.org/10.1111/ijau.12158
- Chae S, Sarama RF, Vojtech CM, Wang J (2019) The effect of the current expected credit loss
- standard (CECL) on the timing and comparability of reserves. Finance and Economics Discussion Series 2018-20, Federal Reserve Board, revised June 2019. https://doi.org/10.17016/FEDS.2018.020r1
- Covas F, Nelson W (2018) Current expected credit loss: Lessons from 2007-2009. Bank Policy Institute Staff Working Paper 2018-1. https://dx.doi.org/10.2139/ssrn.3215559
- ECB (European Central Bank) (2020) ECB Banking Supervision provides further flexibility to banks in reaction to coronavirus. Press release, 20 March. https://www.bankingsupervision.europa.eu/press/pr/date/2020/html/ssm.pr200320~4cdbbcf466.en.html
- Ertan A (2019) Expected losses, unexpected costs? Evidence from SME credit access under IFRS 9. Working paper. https://dx.doi.org/10.2139/ssrn.3504708
- ESMA (European Securities and Market Authority) (2014) ESMA sets enforcement priorities for listed companies’ financial statements. ESMA/2014/1310. https://www.esma.europa.eu/sites/default/files/library/2015/11/2014-1310_esma_sets_enforcement_priorities_for_listed_companies_financial_statements_final.pdf
- ESMA (European Securities and Market Authority) (2020a) Accounting implications of the COVID-19 outbreak on the calculation of expected credit losses in accordance with IFRS 9. ESMA32-63-951. https://www.esma.europa.eu/sites/default/files/library/esma32-63-951_statement_on_ifrs_9_implications_of_covid-19_related_support_measures.pdf
- ESMA (European Securities and Market Authority) (2020b) Public Statement: Implications of the COVID-19 outbreak on the half-yearly financial reports. ESMA32-63-972. https://www.esma.europa.eu/sites/default/files/library/esma32-63-972_public_statement_on_half-yearly_financial_reports_in_relation_to_covid-19.pdf
- ESMA (European Securities and Market Authority) (2020c) Public Statement, European common enforcement priorities for 2020 annual financial reports, ESMA32-63-1041. https://www.esma.europa.eu/sites/default/files/library/esma32-63-1041_public_statement_on_the_european_common_enforcement_priorities_2020.pdf
- Freeman RE (1984) Strategic management: A stakeholder approach. Pitman (Boston MA).
- Gaffney E, McCann F (2019) The cyclicality in SICR: mortgage modelling under IFRS 9. ESRB Working Paper Series (No. 92): 1-24. https://www.esrb.europa.eu/pub/pdf/wp/esrb.wp92~bf769a68b8.en.pdf
- Gelb DS, Zarowin P (2002) Corporate disclosure policy and the informativeness of stock prices. Review of Accounting Studies 7(1): 33–52. https://doi.org/10.1023/A:1017927530007
- Huttenhuis J, Bout B-J, Ter Hoeven R (2019) IFRS 9 en Europese banken; het eerste toepassingsjaar verslagen. Maandblad voor Accountancy en Bedrijfseconomie 93(11/12): 343-359. https://doi.org/10.5117/mab.93.47100
- IASB (International Accounting Standard Board) (2020a) IFRS 9 and covid-19: Accounting for expected credit losses applying IFRS 9 Financial Instruments in the light of current uncertainty resulting from the covid-19 pandemic.
- Kanagaretnam K, Krishnan GV, Lobo GJ (2010) An empirical analysis of auditor independence in the banking industry. The Accounting Review 85(6): 2011–2046. https://doi.org/10.2308/accr.2010.85.6.2011
- Krüger S, Rösch D, Scheule H (2018) The impact of loan loss provisioning on bank capital requirements. Journal of Financial Stability 36: 114–129. https://doi.org/10.1016/j.jfs.2018.02.009
- Kund AG, Rugilo D (2018) Does IFRS 9 Increase Financial Stability? Working paper. https://dx.doi.org/10.2139/ssrn.3282509
- Leventis S, Dimitropoulos PE, Anandarajan A (2012) Signalling by banks using loan loss provisions: the case of the European Union. Journal of Economic Studies 39(5): 604–618. https://doi.org/10.1108/01443581211259509
- López Espinoza G, Ormazabal G, Sakasai Y (2021) Switching from Incurred to Expected Loan Loss Provisioning: Early evidence. Journal of Accounting Research 59(3): 757–804. https://doi.org/10.1111/1475-679X.12354
- Löw E, Schmidt LE, Thiel LF (2019) . Accounting for financial instruments under IFRS 9–First-time application effects on European banks’ balance sheets. European Banking Institute Working Paper Series 2019 (48). https://dx.doi.org/10.2139/ssrn.3462299
- Marlin S (2020) CECL working as intended amid COVID-19 crisis, says FASB. Risk.net, 18 March. https://www.risk.net/risk-management/7507111/ceclworking-as-intended-amid-covid-19-crisis-says-fasb (accessed 30 November 2021)
- Ntim CG, Lindop S, Thomas DA (2013) Corporate governance and risk reporting in South Africa: A study of corporate risk disclosures in the pre- and post-2007/2008 global financial crisis periods. International Review of Financial Analysis 30: 363–383. https://doi.org/10.1016/j.irfa.2013.07.001
- SEC (U.S. Securities and Exchange Commission) (2020) Coronavirus (COVID-19), Division of Corporate Finance Securities and Exchange Commission, CF disclosure Guidance: Topic no. 9. SEC (United States of America). covid-19-spotlight.pdf (azureedge.net).
- Spence MA (1973) Job market signaling. Quarterly Journal of Economics 87(3): 355–374. https://doi.org/10.2307/1882010
- Vergoossen RGA, van Beest F (2020) Coronacrisis en de financiële verslaggeving van Nederlandse beursfondsen. Maandblad Voor Accountancy en Bedrijfseconomie 94(11/12): 417-426. https://doi.org/10.5117/mab.94.60124
Appendix 1
| G-SIBs | Country of incorporation | Reporting standard | Date Year-end | Balance sheet total 2020 | ECL 2020 |
|---|---|---|---|---|---|
| Citigroup | United States | US GAAP | 31-12-20 | 2,260,090 | 24,956 |
| HSBC | United Kingdom | IFRS | 31-12-20 | 2,984,164 | 14,707 |
| JP Morgan Chase | United States | US GAAP | 31-12-20 | 3,386,071 | 30,737 |
| Bank of America | United States | US GAAP | 31-12-20 | 2,819,627 | 18,802 |
| Bank of China | China | IFRS | 31-12-20 | 3,748,736 | 63,259 |
| Barclays | United Kingdom | IFRS | 31-12-20 | 1,832,262 | 11,317 |
| BNP Paribas | France | IFRS | 31-12-20 | 3,056,464 | 29,601 |
| China Construction Bank | China | IFRS | 31-12-20 | 4,321,677 | 88,652 |
| Deutsche Bank | Germany | IFRS | 31-12-20 | 1,627,736 | 6,075 |
| Industrial and Commericial Bank of China | China | IFRS | 31-12-20 | 5,122,468 | 82,558 |
| Agricultural Bank of China | China | IFRS | 31-12-20 | 4,179,239 | 96,966 |
| Bank of New York Mellon | United States | US GAAP | 31-12-20 | 469,633 | 358 |
| Credit Suisse | Switzerland | US GAAP | 31-12-20 | 912,569 | 1,739 |
| Goldman Sachs | United States | US GAAP | 31-12-20 | 1,163,028 | 3,874 |
| Groupe BPCE | France | IFRS | 31-12-20 | 1,776,365 | 16,903 |
| Groupe Credit Agricole | France | IFRS | 31-12-20 | 2,723,637 | 24,846 |
| ING Bank | Netherlands | IFRS | 31-12-20 | 1,151,199 | 7,098 |
| Morgan Stanley | United States | US GAAP | 31-12-20 | 1,115,862 | 835 |
| Royal Bank of Canada | Canada | IFRS | 31-10-20 | 1,219,662 | 4,234 |
| Santander | Spain | IFRS | 31-12-20 | 1,852,493 | 29,010 |
| Societe Generale | France | IFRS | 31-12-20 | 1,795,628 | 14,703 |
| Standard Chartered | United Kingdom | IFRS | 31-12-20 | 789,050 | 6,613 |
| State Street | United States | US GAAP | 31-12-20 | 314,706 | 126 |
| Toronto Dominion | Canada | IFRS | 31-10-20 | 1,288,220 | 6,224 |
| UBS | Switzerland | IFRS | 31-12-20 | 1,125,765 | 1,211 |
| UniCredit | Italy | IFRS | 31-12-20 | 1,144,052 | 1,551 |
| Wells Fargo | United States | US GAAP | 31-12-20 | 1,955,163 | 18,516 |
Appendix 2
| No. | Disclosure elements | Source | Total Count | Percentage | Count IFRS | Percentage | Count US GAAP | Percentage |
|---|---|---|---|---|---|---|---|---|
| 1 | Measurement of ECL is stated | IFRS 9.5.5.17 /IAS 1.117 | 27 | 100% | 18 | 100% | 9 | 100% |
| 2 | Disclosure of period measuring ECL | IFRS 9.5.5.19 /9B.5.5.38 | 19 | 70% | 12 | 67% | 7 | 78% |
| 3 | Disclosure regarding methods used to calculate ECL | IFRS 7.35B (a) /7.35G | 27 | 100% | 18 | 100% | 9 | 100% |
| 4 | Disclosure regarding assumptions used to calculate ECL | IFRS 7.35B (a) /7.35G | 27 | 100% | 18 | 100% | 9 | 100% |
| 5 | Disclosue regarding the credit risk exposure (including commitments and significant credit risk concentrations) | IFRS 7.35B (c) /7.35K (a) | 26 | 96% | 18 | 100% | 8 | 89% |
| 6 | Disclosure regarding credit risk exposure and ECL by credit risk grades | IFRS 7.35M | 24 | 89% | 17 | 94% | 7 | 78% |
| 7 | Disclosure regarding what is defined as a significant increase of credit risk | IFRS 7.35F (a) | 18 | 67% | 18 | 100% | 0 | 0% |
| 8 | Disclosure regarding the definition of default | IFRS 7.35F (b) | 23 | 85% | 17 | 94% | 6 | 67% |
| 9 | Geographical split in ECL calculation | Best practice | 14 | 52% | 12 | 67% | 2 | 22% |
| 10 | Industry split in ECL calculation | Best practice | 10 | 37% | 8 | 44% | 2 | 22% |
| 11 | Dislosure regarding the write-off policy (including expectation of recovery) | IFRS 35F (e) | 22 | 81% | 15 | 83% | 7 | 78% |
| 12 | Disclosure number of scenario’s (and if so how many). | Huttenhuis, Bout & ter Hoeven (2019) | 25 | 93% | 17 | 94% | 8 | 89% |
| 13 | Disclosure of weight of each scenario | Huttenhuis, Bout & ter Hoeven (2019) | 13 | 48% | 11 | 61% | 2 | 22% |
| 14 | Sensitivity analysis performed on ECL/impairments |
|
15 | 56% | 13 | 72% | 2 | 22% |
| 15 | Disclosure for the reasons for the sensitivity | ESMA (2020) | 12 | 44% | 11 | 61% | 1 | 11% |
| 16 | Disclsoure on methodology used for sensitivity analysis | ESMA (2020) | 11 | 41% | 11 | 61% | 0 | 0% |
| 17 | Disclosure of support measure (forbearance) and impact on ECL | IFRS 7.35F /7.35I | 15 | 56% | 12 | 67% | 3 | 33% |
| 18 | Qualitative disclosures regarding risk origination and management | IFRS 7.33 | 27 | 100% | 18 | 100% | 9 | 100% |
| 19 | Quantitative disclosures on loan origination | Best practice | 1 | 4% | 0 | 0% | 1 | 11% |
| 20 | Qualitative disclosure (policy) regarding the collateral held | IFRS 7.35K (b) /7.38 (b) | 24 | 89% | 16 | 89% | 8 | 89% |
| 21 | Quantitative disclosure regarding the collateral held | IFRS 7.35K (c) | 21 | 78% | 17 | 94% | 4 | 44% |
| 22 | Disclosure regarding collateral held mitigates credit risk | IFRS 7.36 /7.38 | 22 | 81% | 17 | 94% | 5 | 56% |
| 23 | Disclosure of forward looking information regarding inputs to the calculation (macro-economic information, including source) | IFRS 7.35G | 25 | 93% | 18 | 100% | 7 | 78% |
| 24 | Disclosure of deviation of ECL versus booked loss on stage 3 loans | Best practice | 14 | 52% | 13 | 72% | 1 | 11% |
| 25 | Disclosure on development of ECL (stemming from notional movement, PD/LGD movement etc) | ESMA (2020) | 17 | 63% | 15 | 83% | 2 | 22% |
| 26 | ECL post model adjustment (Management Overlay) is explained | Best practice | 15 | 56% | 10 | 56% | 5 | 56% |
| 27 | Debt moratoria (payment holidays) granted and effect on Financial statement is explained | Best practice | 24 | 89% | 15 | 83% | 9 | 100% |
| 28 | Impact of debt moratoria on SICR definition is disclosed | Best practice | 13 | 48% | 13 | 72% | 0 | 0% |
| 29 | Disclosure regarding the exposures subject to the payment moratoria | Best practice | 15 | 56% | 12 | 67% | 3 | 33% |
| 30 | Change of inputs (and forecasting) in ECL models compared with prior years | Best practice | 18 | 67% | 13 | 72% | 5 | 56% |
| 31 | Have the different scenarios (and their weights) used in the ECL calculation changed, compared to prior year | Best practice | 16 | 59% | 12 | 67% | 4 | 44% |
| 32 | Dislcosure regarding movements from Stage 1 to Stage 3 | Best practice | 15 | 56% | 15 | 83% | 0 | 0% |